
Università degli Studi di Pavia
Centro Interdisciplinare di Bioacustica e Ricerche Ambientali
Via Taramelli 24 - 27100 Pavia - Italy
e-mail : cibra@unipv.it
Technical tips, tricks and equipment tests
Choosing the right equipment for a specific research is not a trivial task. Often technical specifications are not complete and thus we often need to make our own tests to verify if an instrument is suitable or not for our needs.
This page is intended to make our findings available to everyone interested in sound recording, to help in choosing the right equipment and in getting the best results.
Signal Acquisition
Aliasing & Anti-Aliasing filters
The sampling theorem states that to preserve all the information in an analog signal it is required to sample it with a sampling frequency higher than two times the bandwidth of the signal itself. If we use a given sampling rate, and the signal contains frequencies higher than half the sampling rate (called Nyquist frequency), the sampling produces artifacts, i.e. new components not present in the original signal.
To avoid this, it is required to filter the signal to limit its bandwidth to half of the sampling rate. The required filters (low-pass filters) should be sharp enough to cut frequencies above the Nyquist frequency while leaving intact the frequencies below it. Unfortunately such a filter does not exists; all filters have a transition bandwidth with a roll-off normally expressed in dB/octave. Higher the value, sharper the filter, but also more expensive! AD converters in normal audio equipment have relatively smooth a-a filters that attenuate frequencies starting at few kHz below Nyquist but not completely cut at Nyquist! Often the attenuation at Nyquist is in the range 6 to 12 dB, and the maximum attenuation (the Zero of the filter) is located well beyond Nyquist. This means that aliasing may occur more frequently than one could think, in particular when recording sounds with wide bandwidth, largely exceeding the Nyquist frequency.
In such a case all the frequencies in the range Nyquist to Zero can produce aliasing, i.e. artifacts that lie in the range Nyquist-Zero to Nyquist. The Nyquist frequency acts like a mirror that reflects all frequencies extending beyond Nyquist back in the range below it. Given a frequency f beyond Nyquist, a new signal - the alias - is created with frequency Nyquist-(f-Nyquist).
If we have to face with wideband signals, the aliasing-free range is given by Nyquist - Zero, but considering real-world cases, it is reasonable to consider safe the frequency range for which the aliasing may appear at levels below -60dB.
Aliasing on a spectrogram
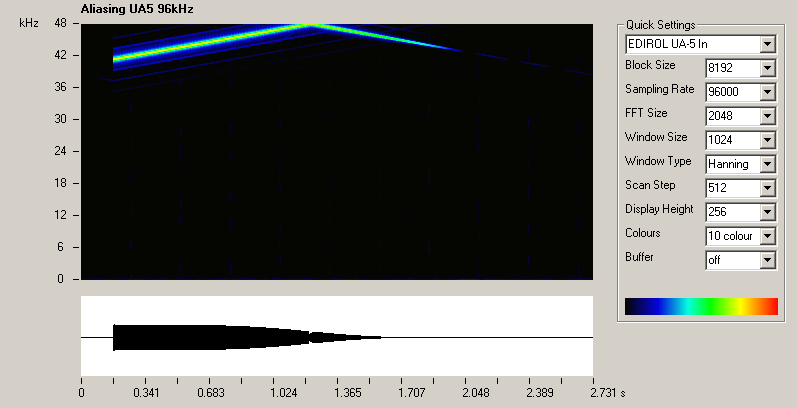
Edirol UA5 fed with a sinusoidal frequency sweeping from 40 kHz up to 100 kHz. The sampling rate is 96K and thus the Nyquist frequency is 48 kHz. In an ideal system with a very sharp anti-aliasing filter the spectrogram should show the input signal only up to 48 kHz, and nothing when the signal frequency goes beyond Nyquist. In this real-world example when the signal frequency f goes beyond Nyquist, a new signal - the alias - is created with frequency Nyquist-(f-Nyquist). If aliasing occurs, a 50 kHz input generates a 46 kHz alias; a 52 kHz input generates a 44 kHz alias; and so on. The amplitude of the alias (in this spectrogram the alias is the down-sweep trace) depends on the attenuation of the a-a filter at the input frequency. If the attenuation is -10 dB at 50 kHz, the alias will be 46 kHz with a level of -10dB ref the input level.
How to read the graphics
To test the equipment I used a signal generator set to produce a sinusoid sweeping in frequency up to 200 kHz (and more, in some cases). The tests here reported have been made during several years of research and equipment testing at CIBRA and they have been made with different signal levels. In some cases the signal was set to -6dB (ref the overload level), in other tests the level was set to -20dB. The graphs shown here have been normalized to an arbitrary 0 dB that is just the level of the test signal.
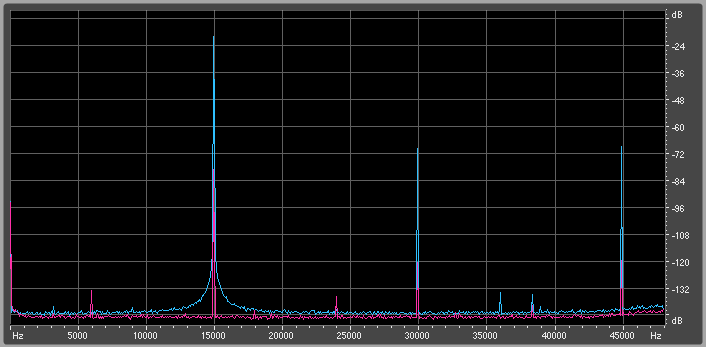
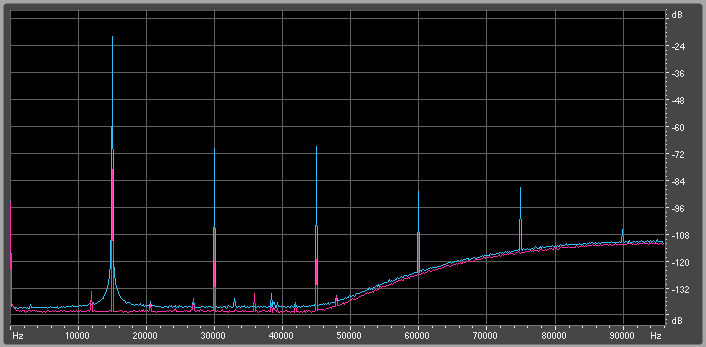
Measures have been made with the SeaPro software (track option) and then imported into Excel. The graphs show the overall frequency response of the device (analog stages and AD converter) below the Nyquist frequency, the frequency response beyond Nyquist and the level of aliases generated by the input signal going beyond Nyquist.
The pink line shows the level of the signal after AD conversion; it clearly shows that when the signal goes beyond the Nyquist frequency another signal appears that is the alias of the "real" signal. The blue line is the frequency response of the device and its a-a filters reconstructed by using the aliased component.
The aliasing-free range can be considered the frequency at which the pink line intersects the -60 dB level. Of course this measure is important when wideband signals extending beyond the Nyquist frequency with high levels have to be recorded. When recording band limited sources or when using bandlimited sensors the aliasing problem is greatly reduced.
NB: the ripples in the curves are due to the tracking software I was using more than 10 years ago.
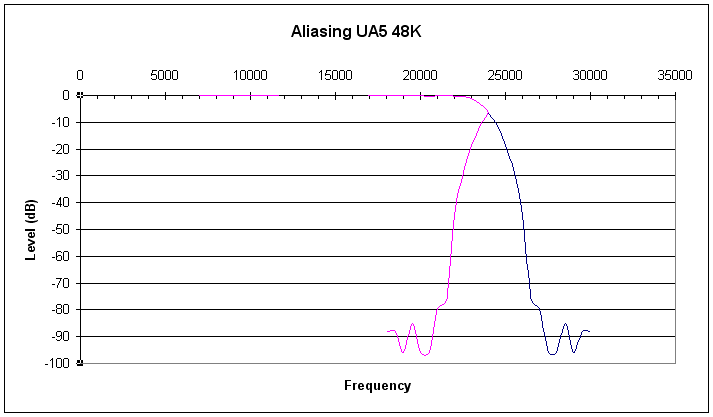
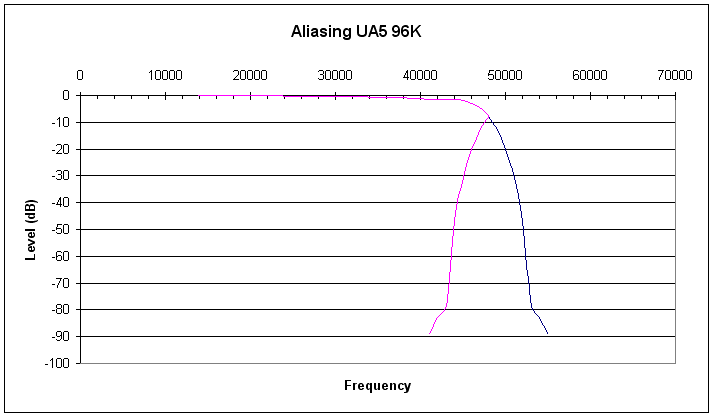
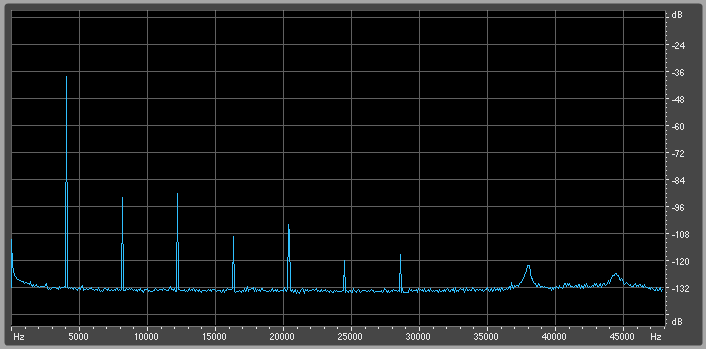
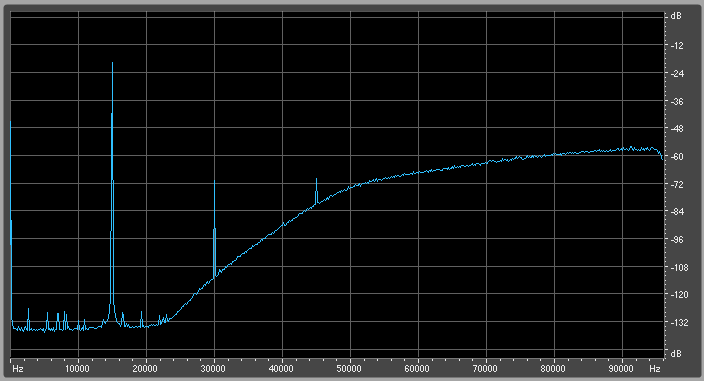
Edirol UA5 at 48K and 96K. An excellent USB interface with still use.
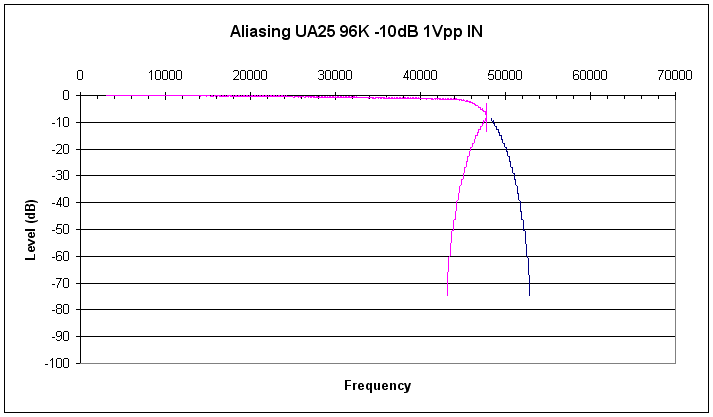
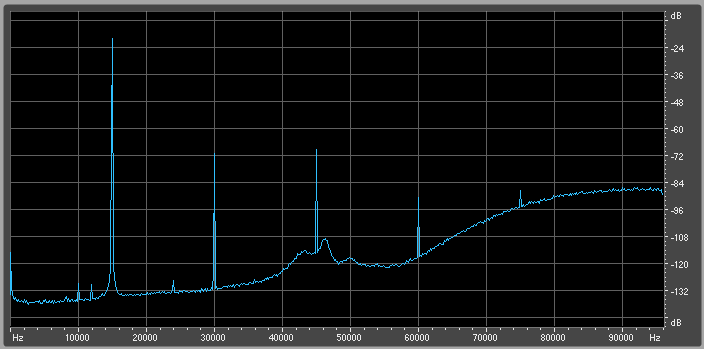
Edirol UA25 at 96K. Excellent performance in a cheap self-powered device.
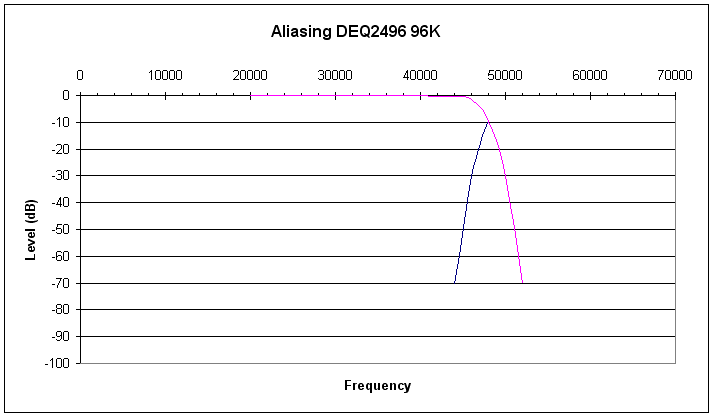
Behringer UltraCurve DEQ2496. Excellent AD/DA interface with powerful DSP for real-time processing.
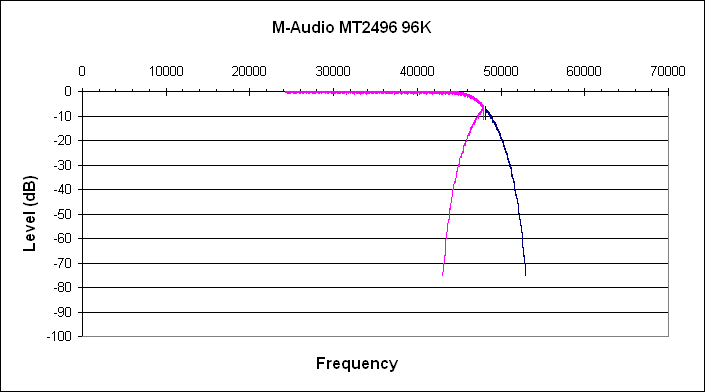
M-Audio MT2496 - TSR input. Pocket size CF recorder.
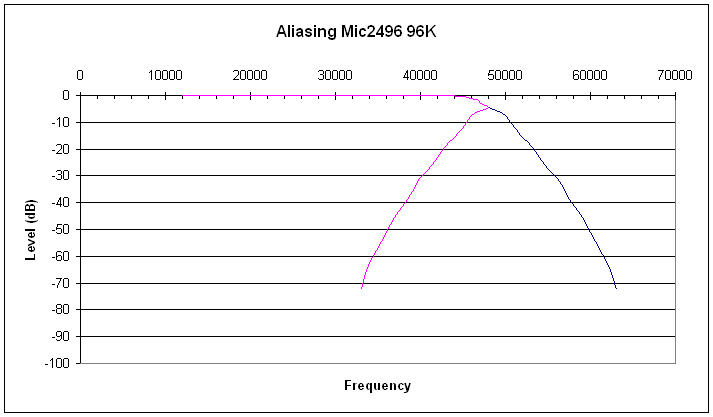
CoreSound Mic2496. Small microphone preamplifier with AD.
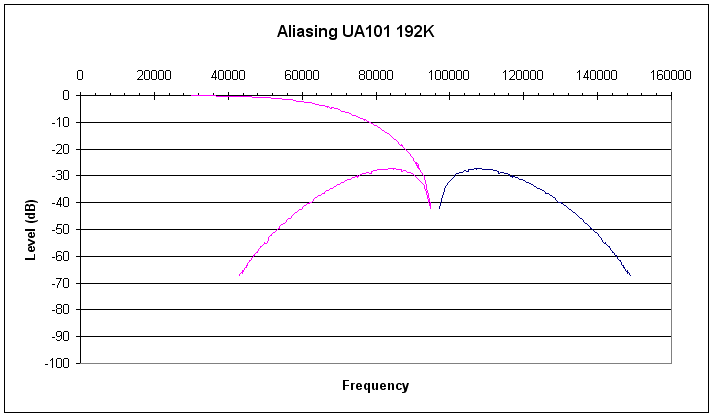
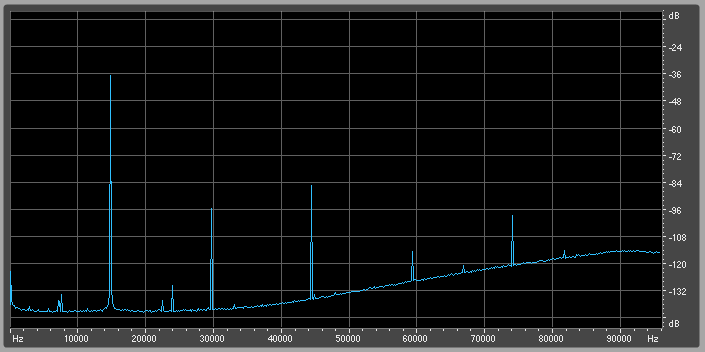
Edirol FA-101 - FireWire audio interface. At 96 kHz works well, but at 192 kHz shows a frequency response falling above 50 kHz with a very strange anti-aliasing behaviour. The FA-66 performs same way.
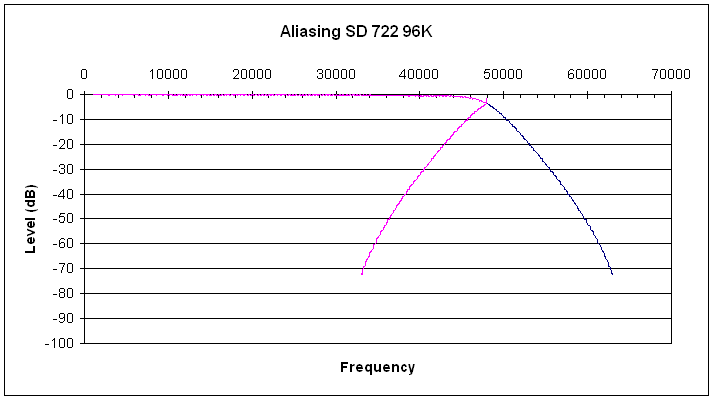
Sound Devices 722 - Line input response at 96K.
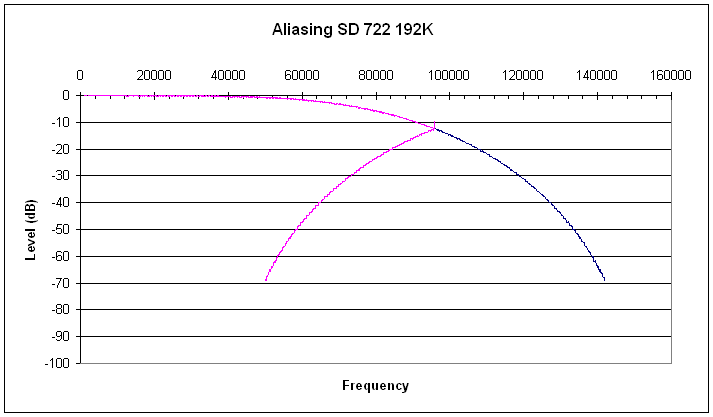
Sound Devices 722. Line input response at 192K.
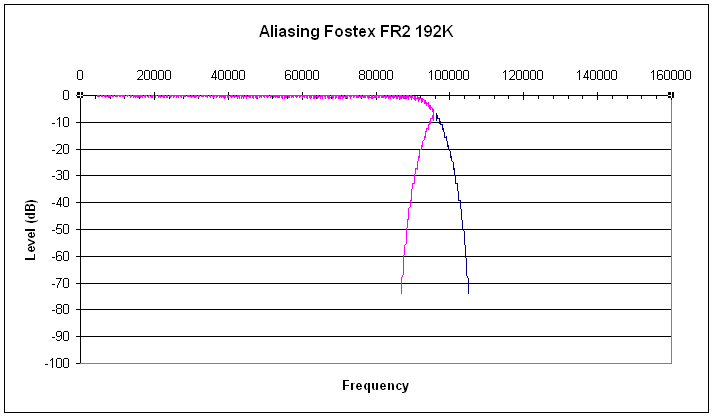
Fostex FR-2 Recorder at 192 kHz. Recording made by Rudy Trubitt. Ripples on the curves are due to the tracking algorithm.
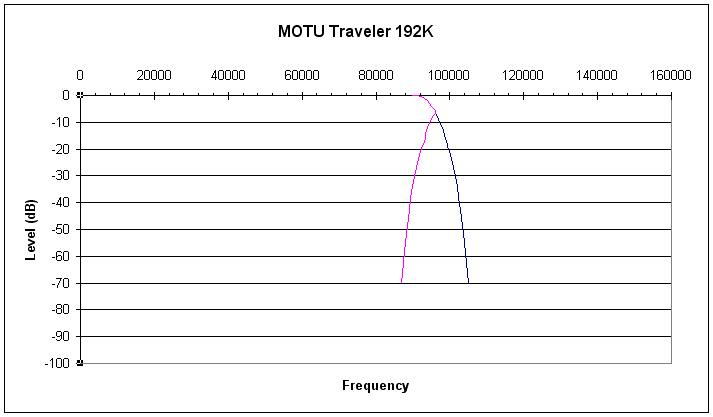
MOTU Traveler at 192K
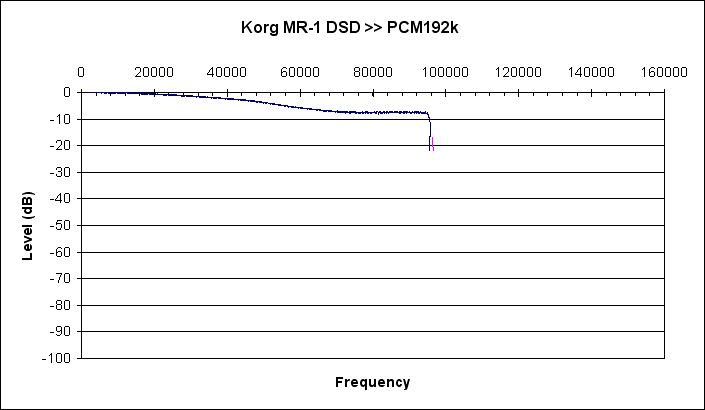
Frequency response and anti-aliasing filters after converting DSD to PCM 192k with AudioGate.
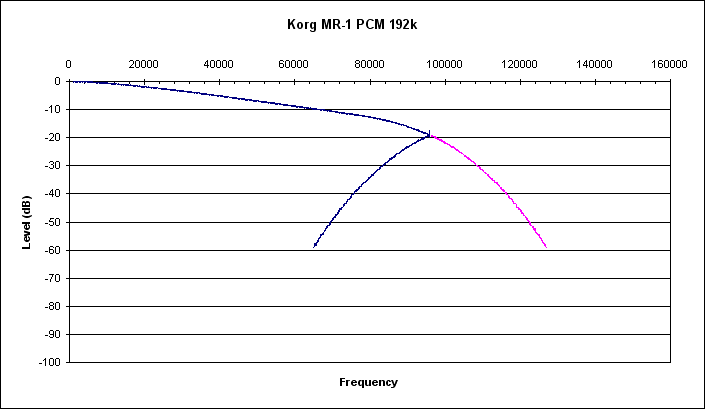
Korg MR-1 : Frequency response and anti-aliasing filter with PCM recording at 192k.
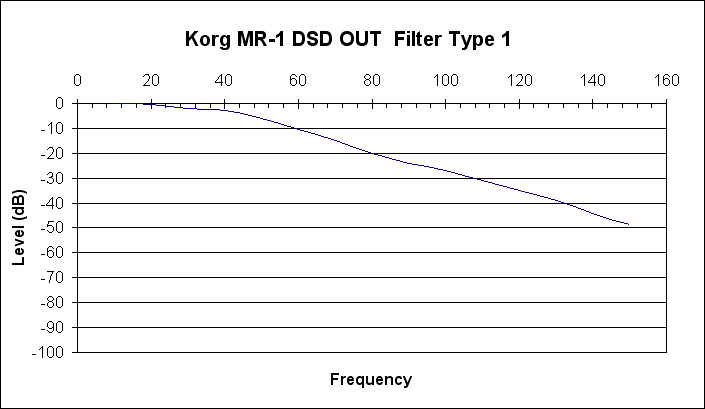
Korg MR-1 : frequency response at the analog out. Output
Filter Type set to 1. A less steep Filter Type 2 is also
available.
Measure taken with NI-DAQ 6070 at 480000s/s
Other issues related to 192K sampling
Frequency response and aliasing artifacts are not the only issues to be considered when choosing a 192K recording device. In some devices I tested I noticed an increase in the background noise above 1/4 of the sampling rate (1/2 Nyquist). In noisy (hissy) devices this is not very evident, but in very silent devices the noise increase become evident.
M-Audio MT2496. Recording 96k 24bit, line in, -40dB 15 kHz. Spectrum made with Adobe Audition, FFT size 65536, Kaiser window.
Averaged spectrum of a 15 kHz tone recorded at -20dB on a SD 722 (Line In level 8) at 96K, 24 bit, left channel. Spectrum made with Adobe Audition, FFT size 65536, Kaiser window. The SD 722 shows a very low and almost flat noise floor.
Averaged spectrum of a 15 kHz tone recorded at -20dB on a
SD 722 (Line In level 8) at 192K, 24 bit. Spectrum made
with Adobe Audition, FFT size 65536, Kaiser window. The
noise floor increases of about 30 dB above 48 kHz .
Harmonics of the 15kHz tone are due to the generator, not
the recorder.
MOTU Traveler, 192k 24bit, 0 dB Gain, -40dB 15kHz test signal. Averaged Spectrum made with Adobe Audition, FFT size 65536, Kaiser window.
Korg MR-1. 15 kHz tone at -20dBV. DSD converted to PCM 192k by using AudioGate. Spectrum made with Adobe Audition, FFT size 65536, Kaiser window. More than 90dB noise increase at frequencies >80kHz!
Korg MR-1. 15 kHz -20dB tone. Line in, PCM 192k recording. More than 40 dB of noise increase!
Devices tested, but measures non saved
Lynx Two - 192kHz PCI board. Shows very flat frequency response up to 92 kHz and steep anti-aliasing filters at both 96 and 192K. It can be set to sample up to 200kHz.
MOTU HD192 - 192kHz, 12 channels, shows very flat frequency response and steep anti-aliasing filters at 192K.
Other devices we have in the lab (to be tested soon...)
M-Audio LT1010 - PCI 8 channels 96K audio interface
Behringer UltraVoice VX2496 - microphone preamplifier with 96K audio interface
Pioneer DC88 - 96kHz portable DAT recorder
Teac DA20 - 48kHz DAT recorder
Teac DA40 - 48kHz DAT recorder
Other important features to be verified...
Frequency response, Distortion and Signal to Noise ratio are the most obvious features to characterize a device, but the "audio quality" is a mix of different features. Some can be clearly defined by simple specifications, but others require specific tests (or listening sessions) to be revealed.
Here three spectrograms of a same sinusoidal signal acquired with three low cost devices (the black thick trace below the spectrogram shows that the signal was acquired very close to the overload level of the devices.
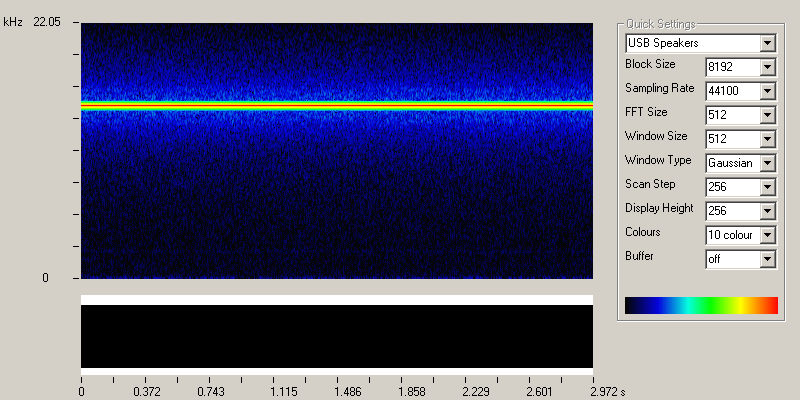
Edirol UA3
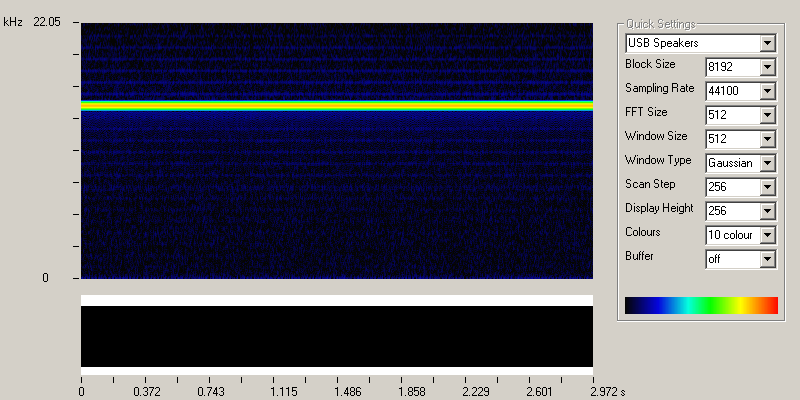
Edirol UA30
Edirol UA5
Digital I/O
Digital I/O is becoming an important
feature of any sound device connected to a computer. By
digital I/O (either electrical SPDIF, electrical AES/EBU,
or optical SPDIF) it is possible to record in a computer
file the exact incoming digital stream without any further
processing or conversion. Unfrtunately this is not always
true and thus it is important to carefully verify the
digital I/O capabilities of the board you choose: some
cheap devices don't perform direct digital transfer of
data but they do perform a real-time sampling rate
conversion (SRC) in the digital domain. This might be
sometime useful, for example to downsample to 44.1kHz a
48kHz DAT recording for CD mastering purposes, or to
resolve problems due to slightly different clocks
different digital devices may have. Unfortunately, in
these devices, sample rate conversion may occur even if
transferring a 48kHz DAT recording to a 48kHz sound file!!
This unnecessary data conversion introduces artifacts
which corrupt the quality of the original data. To
preserve the full quality of the original data the sound
boards should get the incoming sample rate to transfer
samples to the PC as they arrive, without any further
processing.
Often technical documentation does not provide information
about this feature and only an accurate test can show if
SRC happens or not.
Here the results of tests made on some devices:
Edirol UA 5: digital resampling occurs
Edirol UA 25: digital resampling occurs
M-Audio MicroTrack 2496: OK, no digital resampling
SEKD Prodif 96 Pro: OK, no digital resampling
M-Audio 1010LT: OK, no digital resampling
CoreSound PDAudio CF: OK, no digital resampling
How to make the test...
How to verify if resampling occurs or
not. You need to have a sound board with digital output;
here I assume the board outputs the samples as they are in
the file you play, without any processing.
Create a wav file with an "impossible" signal just at the
Nyquist frequency, that is half the sample rate. To do
this you can use Adobe Audition. In version 2: create new
file, say stereo 96 kHz 16 bit. Then "Generate", then
"Tones", in the "Generate Tones" panel set the frequency
to half the chosen sample rate (48000 for 96000), set 0 in
the modulation fields, select sine type of waveform, set
start phase 90, set 100 for the 1st component, set 0 for
the harmonics. Set the output level to -6dB.
Generate the signal. Then examine the waveform by zooming at sample level: you should see alternated positive and negative samples, all positive samples with same height, all negative samples with same height. Now you have a signal with exactly the frequency of half the sample rate. (you should also see the interpolated sinusoid generated by Audition).
Play the signal thorough the digital output and record it on the device you want to test. Then examine the recorded file with Audition: you should see exactly the same structure you saw after creating the impossible wave. If resampling has occurred you should see something completely different.
If testing a sound board, be sure to check in its settings panel how the board manages incoming digital streams; some boards allow to choose among adapting to the incoming rate or use internal own clock; this second option may mean resampling. In any case repeat the test with all options available.
A further option for doing the test is to burn a CDAudio with the "impossible" file and then use a CD Player with digital output as a source for the test.
Topics we are working on:
The noise of microphones and preamplifiers.
Portable recorders
Microphone problems
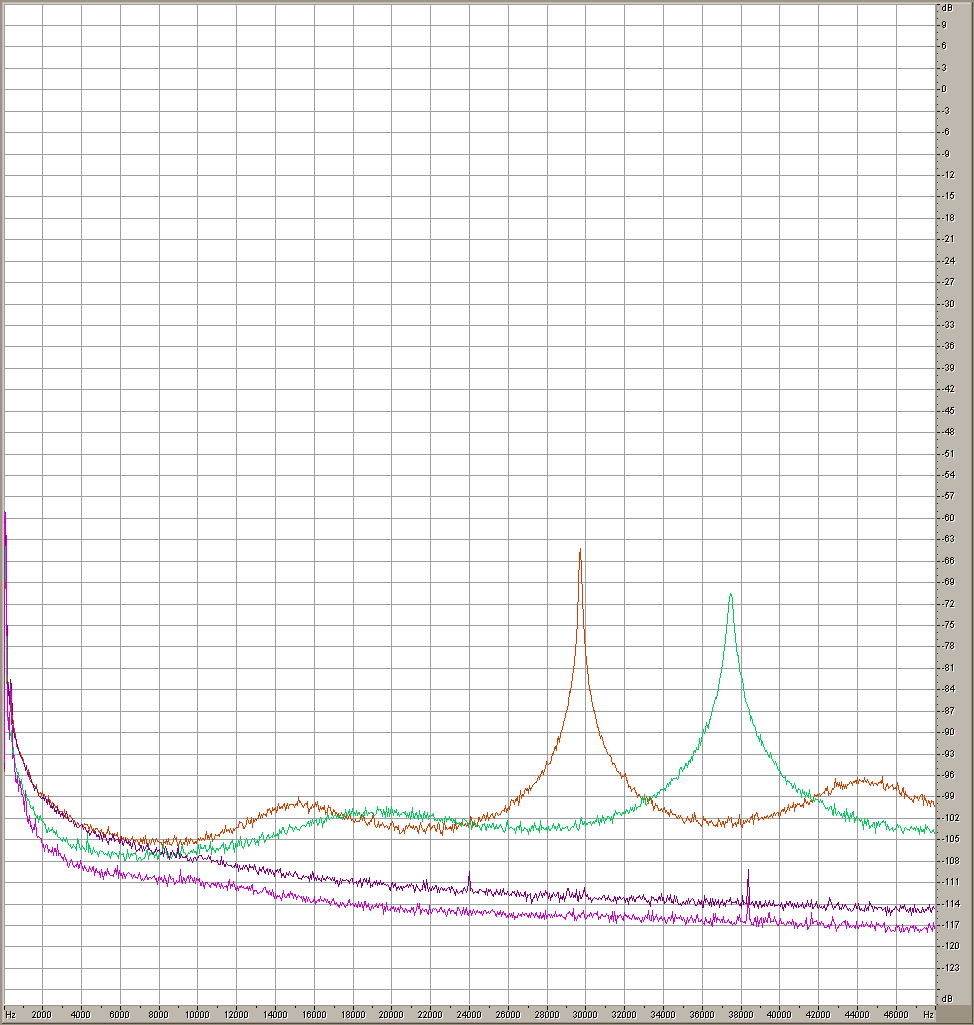
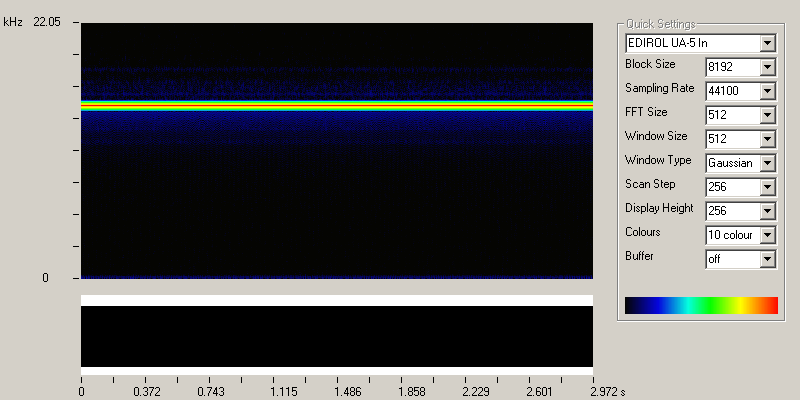
Microphone Sennheiser K6/ME66. Overlay of spectra of a
pair of K6/ME66 recorded with Phantom powering (violet
lines) and the same pair but powered with internal 1.5V
batteries (green and brown lines). Recording made with a
SD722 battery operated, recording to CF, Gain 69dB, in a
quiet room at night. Spectra made with Adobe Audition 2,
FFT 65536. It is evident that on battery power the noise
increases noticeably (by hearing too) starting at 8 kHz
and 2 strong peaks appear in the ultrasonic range. This
pair is now under check at Sennheiser labs in Italy.
A 10 years old K6/ME66 (not shown) does not increases
noise when operating on internal battery, but shows a
narrower and lower peak around 35 kHz.
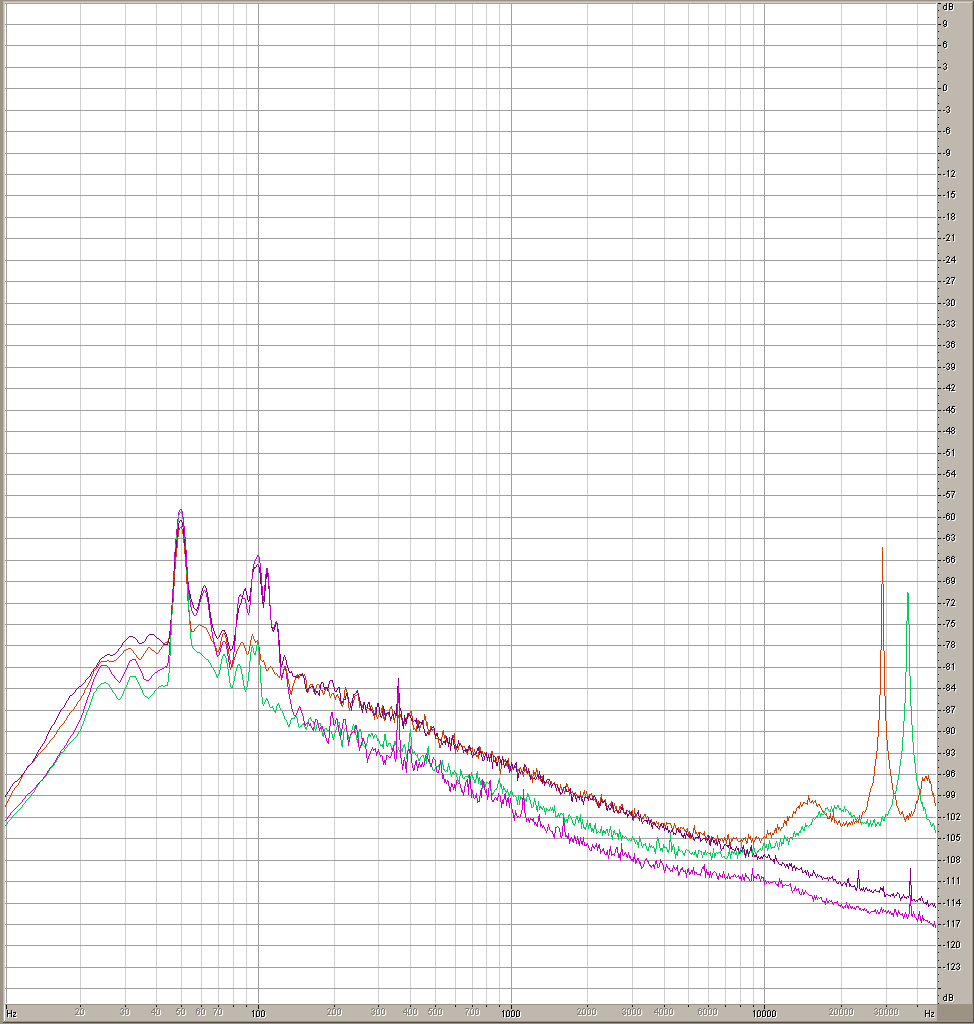
Same recording and setup as above, but plotted on a logarithmic frequency axis. Also to be noted that the two mics have different self noise on both Phantom and battery power. On the log axis, it is also shown that when recording on Phantom there is a higher peak at 100 Hz... Maybe more 2nd harmonic of the 50Hz power line in my home.
Page created by G.Pavan, February 2006. If you like to use these informations and figures, please cite the source!